Summary: Latitude vs. X
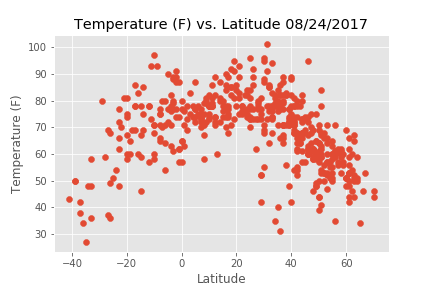
The purpose of this project was to evaluate weather changes the closer one got to the equator. The data for this project was gathered through the use of the Open Weather Map API. This data was gathered through looking at around 500 cities.
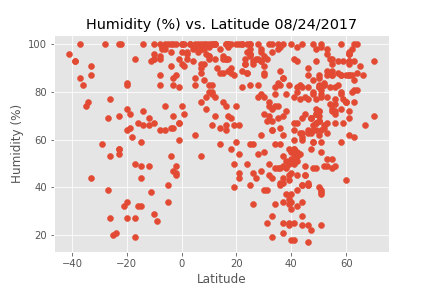
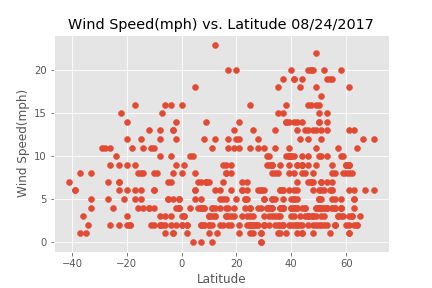
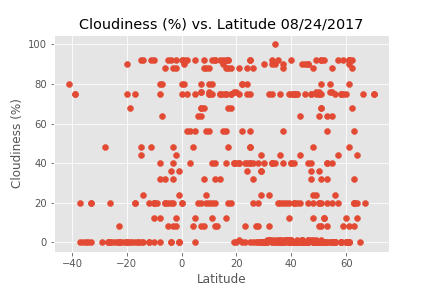
After assembling this dataset, we then placed this data in a dataframe using Pandas. Then, using Matplotlib we plotted various charts that looked at different aspects of weather vs. latitude. These aspects included temperature, humidity, cloudiness, and wind speed. We are providing the Source Data in this site along with descriptions of any trends and correlations we witnessed.
Visualizations